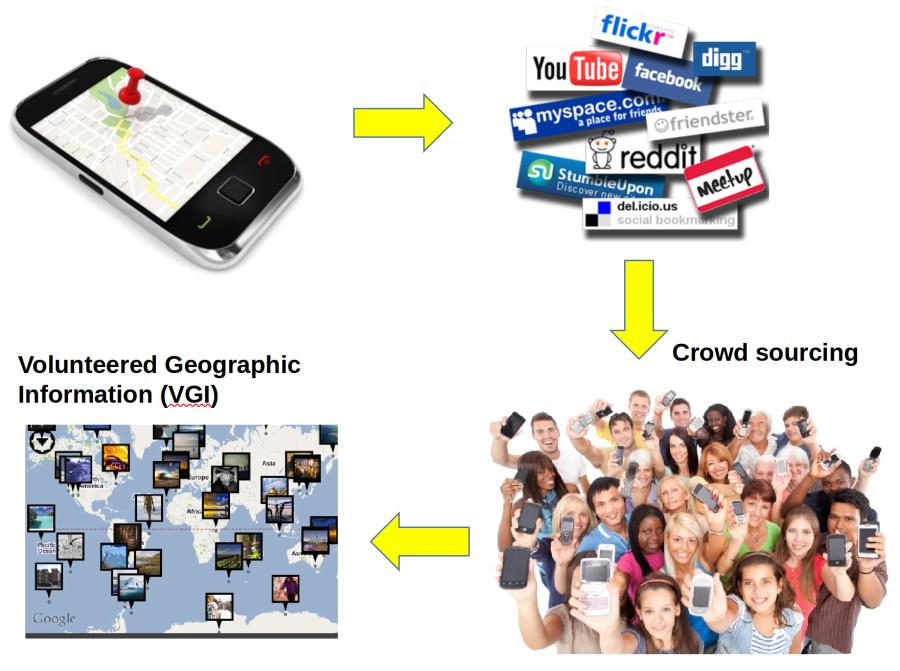
What is Volunteered Geographic Information?
Lately, we tend to interact with a lot of social media and online services. Without a doubt, these activities generate a lot of data, and a huge portion of it has a spatial dimension. Prof. Mike Goodchild of UCSB coined the term Volunteered Geographic Information (VGI) in 2007 [1], which refers to spatial information generated by regular people. You can think of posting a geotagged photo on Instagram, checking-in to your favorite café on Foursquare, or even putting a street on OpenStreetMap, the world's largest collaborative mapping project. Most of us agree that VGI has many advantages over authoritative data or regular sources, such as its timeliness and availability. For example, while it takes some time for news channels to get to a major event and inform the public, locals are probably broadcasting important information right away through Twitter, Snapchat or Facebook. Similarly, while it is not financially beneficial for a map data provider to survey remote roads in Africa, volunteers can close this data gap and build an openly available map for everyone's benefit. And we could just go on with the list of examples...
Don't we already know everything there is to know about VGI?
Well, not quite yet. It's true that researchers realized the potential benefits of VGI and a lot of effort was put into analyzing it over the last decade. Today, we have a detailed understanding of the quality of VGI, and countless studies addressed numerous applications of VGI. Scientists also revealed a lot about the people who generate VGI, because ultimately, everything depends on them. For example, several studies explored global mobility patterns through the lens of Twitter, evaluated photo-sharing preferences of tourists through Flickr and Panoramio and so on. Putting all the pieces together can potentially help us understend the world through what can be gathered from regular people in the form of VGI.
So, what's the deal with your research then?
While we know a lot about how people generally tweet, post on Instagram, or even edit maps, we know very little to nothing about how the same individual user uses these services simultaneously. And the thing is: people do use many services together! Checking in at the airport, posting a photo of your dinner, and tweeting about an interesting talk you hear at a conference? Does it sound familiar? For some, it sure does. The spatial footprint of these activities is slightly different. But how different are they? And why are they different? What can we learn from studying them? This is what I aim to understand and this is what I need your help with.
OK, cool, but what are you hoping to achieve?
I believe in the power of understanding. So, at first I think we need to start from the bottom and get to the point of understanding. I would like to be able to say things like "okay, this is what we see in the data, which is likely attributed to this and that". Only then we can talk about possible implications and significance of the topic. Everyting aside, I hope that through understanding the spatial activity patterns of the same individual througout diferent online services, we can get a better picture of their travel behavior, for example. This information can then be used to provide better travel recommendation systems, or the more detaild information we gather can be fed to various models to estimate carbon dioxide emission, to name a few. We are not there yet, but I am working on it. Your help and participation could push this research to the next level.
How far along are you with this research?
As part of a 2016 study, we noticed that many Mapillary users were active editors of OpenStreetMap (OSM) as well [2]. Results showed platform specific differences in the space usage of users. Namely, the different nature of OSM and Mapillary resulted in different activity spaces, simply because users need to be physically present to take street level Mapillary photos, while they can make remote map edits in OSM while sitting at home.
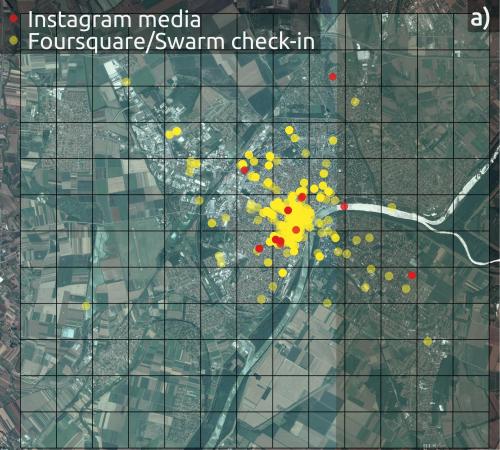
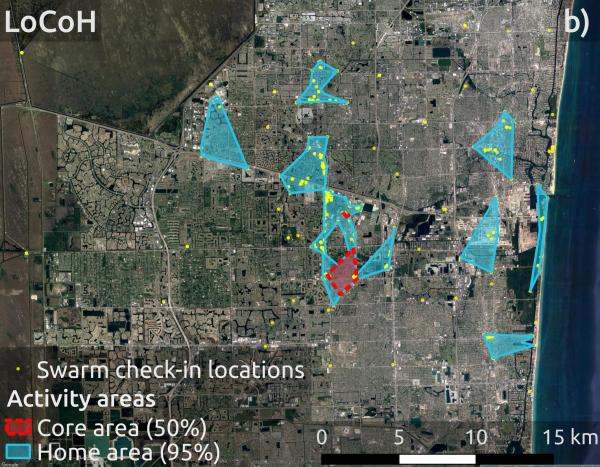
In a pilot study from this year, I analyzed contributions of 10 users to Instagram and Foursquare [3]. This pilot study provided means to asses the performance of methods to a) define user activity spaces from social media data and b) mathematically quantify the (dis)similarity of contributions of the same user to multiple online services. These outcomes are essential for this current study. The pilot study will be presented at the AGILE 2018 conference in Lund, Sweden, so come and say hi!
References
[1] Goodchild, M. F. (2007). Citizens as sensors: the world of volunteered geography. GeoJournal, 69(4), 211-221. [doi: 10.1007/s10708-007-9111-y][2] Juhász, L. and Hochmair, H. H. (2016). Cross-linkage between Mapillary Street Level Photos and OSM Edits. In T. Sarjakoski, M. Y. Santos, L. T. Sarjakoski (Eds.), Geospatial Data in a Changing World – Lecture Notes in Geoinformation and Cartography (pp. 141-156). Berlin: Springer. [doi: 10.1007/978-3-319-33783-8_9, RG]
[3] Juhász, L. and Hochmair, H. H. (2018). Cross-checking user activities in multiple geo-social media networks. 21th AGILE Conference on Geo-information Science. Lund, Sweden [RG]